
From the very beginning of Public Health England, we have been involved in a world-wide project to bring together the widest possible range of knowledge about health and its determinants.
The Global Burden of Disease project involves more than 1,000 researchers in over 100 countries, and pulls together data on premature death and disability from more than 300 diseases and injuries in 188 countries, by age and sex, from 1990 to the present.
This enables us to make meaningful comparisons between countries over time, and rank the diseases and risk factors in terms of their overall burden on a population.
The ‘burden’ is measured by combining two indicators; the number of years of life lost to disease and the number of years lived with disability as a result of disease:
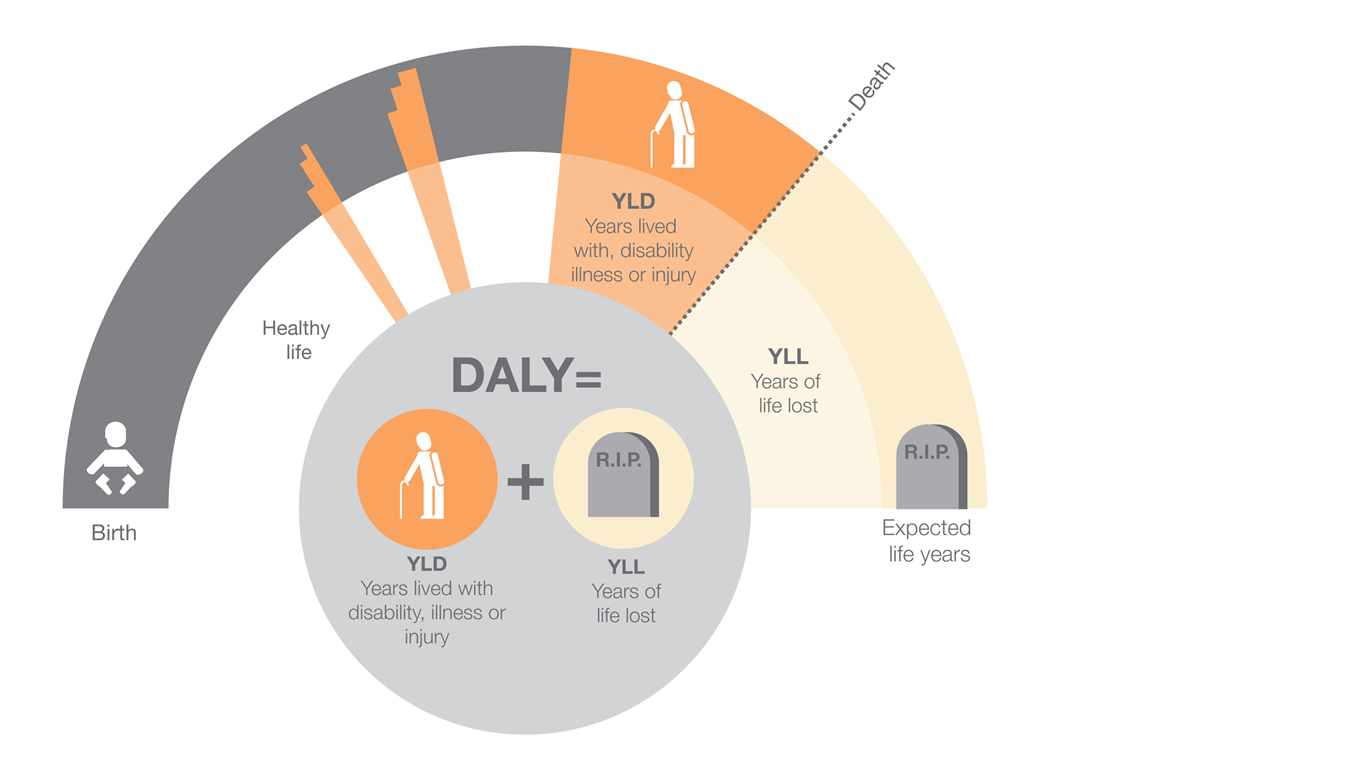
A new analysis of the findings of the project has helped us, for the first time, to rank the diseases and risk factors that cause death and disability in England.
It also ranks England and its regions compared to other high-income nations, in terms of the years of life lost to death and lived with disability (disease burden), overall and by individual disease.
The peer reviewed paper Changes in health in England with analysis by English region and areas of deprivation: findings of the Global Burden of Disease Study 2013 has been published today in The Lancet.
We led the process but we worked with over 70 authors to write the final paper and it is the culmination of years of work. It is an excellent example of collaboration between PHE and academic colleagues in the UK and internationally.
And the findings tell us a lot about how we are affected by disease, disability and death and how this has has changed since 1990.
Also launched today, is a new online tool that enables you to see how the disease burden falls over time by English region and deprivation and the relative impact of different diseases and risk factors.
The online tool allows you to interrogate the data and explore specific questions that may not be covered in the published paper- read more about how to use the tool in a separate blog.
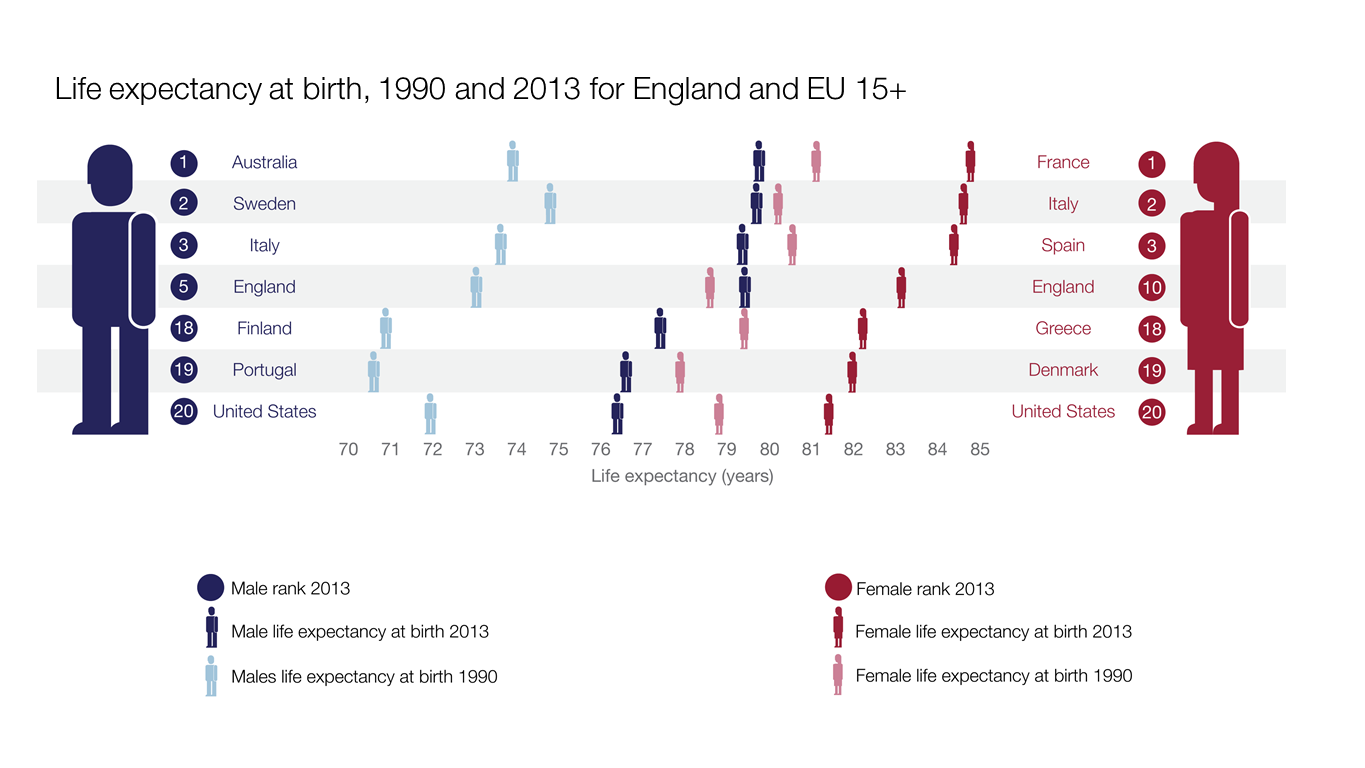
Between 1990 and 2013, life expectancy in England saw one of the biggest increases in EU15+ countries (Austria, Belgium, Denmark, Finland, France, Germany, Greece, Ireland, Italy, Luxembourg, Netherlands, Portugal, Spain, Sweden, plus Australia, Canada, Norway and USA) - a 5.4 year increase from 75.9 years in 1990 to 81.3 years in 2013.
This is mainly because of falls in the death rate from cardiovascular disease, stroke, chronic obstructive pulmonary disease (COPD) and some cancers (with progress partly offset by increased death rates from liver disease).
But while life expectancy has increased, this hasn’t been matched by improvements in levels of ill-health.
So, as a population we’re living longer but spending more years in ill-health. Indeed, for several conditions, although death rates have declined, the overall health burden is increasing.
For example, while deaths rates from diabetes fell by about 56%, the increases in illness and disability associated with diabetes have been substantial, rising by around 75% over the last 23 years.
Sickness and chronic disability are causing a much greater proportion of the burden of disease as people are living longer with several illnesses.
Low back and neck pain is now the leading cause of overall disease burden, with hearing and vision loss, and depression also in the top 10, alongside diseases with a high mortality you would expect, such as ischaemic heart disease, COPD and lung cancer.
This combination of impacts is called multi-morbidity and points to the kind of challenges we as public health and healthcare professionals will have to deal with into the future.
While life expectancy overall has increased, there has been little, if any, improvement in inequalities; by 2013, those living in the most deprived areas are only just approaching the levels of life expectancy that less-deprived groups enjoyed in 1990.
These inequalities are also reflected in the burden of disease and risk factors in that more deprived groups are affected proportionally more by them. The types of disease and risk factor are roughly the same across all deprivation areas however.
Despite having the same health and social care system, some English regions (eg, South West England, East of England, and South East England) now have similar or better levels of health than the best-performing EU15+ countries, whereas other regions (eg, North East England and North West England) are losing ground and have worse health outcomes than any of these nations.
While the paper highlights these regional differences in life expectancy and disease burden it is important to state that the inequalities are actually greater within regions than between them and are therefore largely related to deprivation not geography.
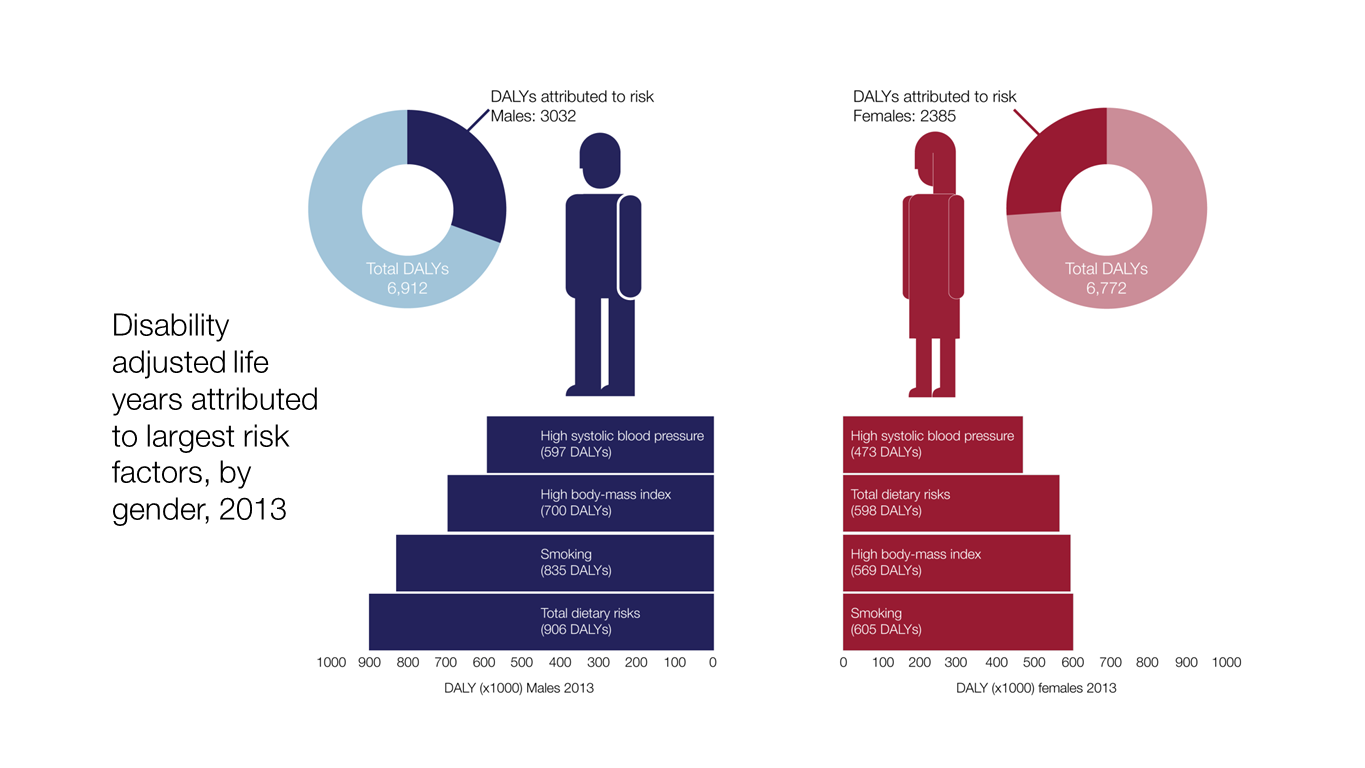
The data also shows us that, in general, behavioural risk factors make the greatest contribution to years lost to death and disability.
The modelling shows us that known risk factors operating together explain 40% of ill health in England. If you examine the impact of specific risks on the overall disease burden, unhealthy diet and tobacco are the two largest contributors (diet accounts for 10.8% of total disease burden and tobacco 10.7%).
What these findings really show is the huge opportunity for preventive public health. If levels of health in the worst performing regions in England matched the best performing ones, England would have one of the lowest burdens of disease of any developed country and that a large proportion of the disease that leads to illness and early death is potentially preventable.
As mentioned, the study represents a huge piece of work, the full implications of which will take time to analyse and build on. Some of the implications will be discussed in future blogs but in the meantime I encourage you to read the paper in full and use the online tool to examine the data for yourself.