

Public Health England’s Wider Determinants of Health tool has been updated, providing the latest data for key indicators of the ‘root causes’ of ill health.
The wider determinants of health are the broad social and economic circumstances into which we are born, live, work and grow older. Examples can be found in this A-Z guide.
What is the Wider Determinants of Health tool?
The tool was developed to support work around the wider determinants of health in local authorities and the wider public health system, including the need to reduce health inequalities.
The tool provides indicators for topics such as income, work and housing. Where possible, links to further resources are provided to allow users of the tool to take further action.
The latest update shows that:
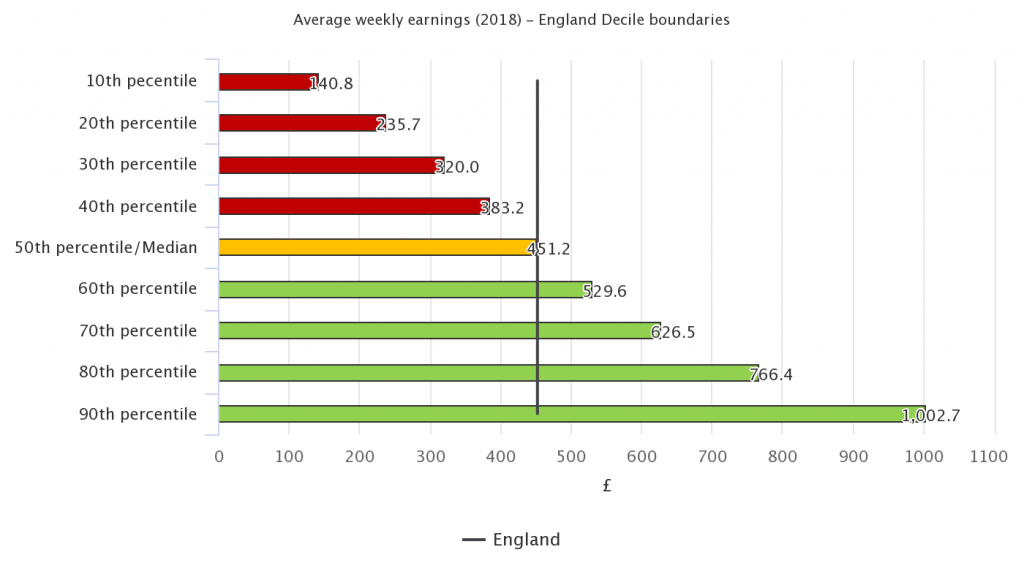
Income inequalities persist
There is a well-established relationship between low income and poor health: low income can lead to poor health and ill health can result in lower earning capacity.
Average weekly earnings have risen gradually since 2011, increasing from £440 in 2017 to £451 in 2018, but these increases do not take into account inflation. However, there is considerable inequality in what people earn. In 2018, the lowest 10% of earners took home just £141 per week while the top 10% earned just over £1,000 per week.
An important aspect of income is whether it provides enough for a socially acceptable standard of living, known as the Minimum Income Standard. Thirty percent of the population did not reach this standard in the period 2014/15 to 2016/17.
Although this percentage has remained similar across the last ten years, there is inequality between regions. The percentage was highest in London (35.5%). Outside London, in the midlands and the north of England a higher percentage of people have an income below the Minimum Income Standard than people in the south and east.
Housing has continued to become less affordable
Housing can impact on our physical health – damp surroundings cause respiratory diseases for example. But poor housing also has a serious bearing on mental health and wellbeing, particularly homes which are cold, unsuitable or overcrowded.
The tool update shows that homes have continued to become less affordable, following the upward trend since 2013. In England in 2018, the median house price was 8 times the median gross annual earnings of full-time workers. Homes were least affordable in London, costing 13.1 times the median annual income, compared with 5.3 times the median annual income in the North East.
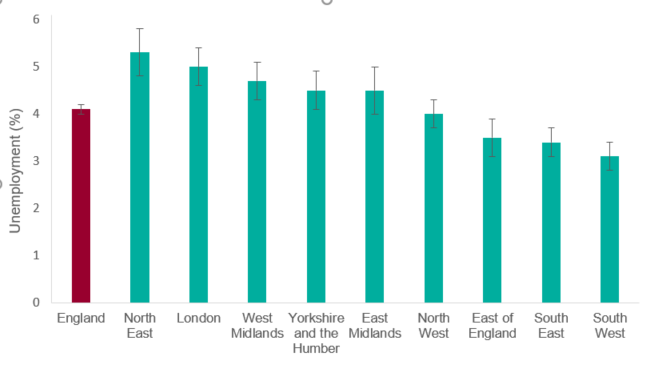
Unemployment has continued to fall
Being in ‘good work’ – having a safe and secure job with good working hours and conditions, supportive management and opportunities for development – is better for your health than being out of work. Unemployment is associated with an increased risk of ill health and death. Our latest data show that unemployment has continued to fall since 2013. In 2018, 4.1% of the economically active population were estimated to be without a job, down from 4.4% in 2017. The unemployment rate remains higher in the North East than in other regions.
The rate for long-term claimants of Jobseeker’s Allowance in 2018 was 3.8 per 1,000 population, showing little change from the previous two years. The rate in the most-deprived decile of the population is approximately six times the rate for the least-deprived.
The Wider Determinants tool also contains an indicator of job density, designed to tell us how many jobs are present in an area relative to the resident population. This ratio has risen steadily since 2013, reaching 0.87 in 2017. This means that in England there are 0.87 jobs per person aged 16-64. Job density is lowest in the North East where the ratio was 0.73 in 2017.
The percentage of 19-24 year olds not in education, employment or training in 2018 remained the same as in 2017 (13.2%), but the general trend has been improving since 2013. The percentage was highest in the North East (19.1%).
Although being employed is associated with many health benefits compared to being out of work, in some cases, work may be detrimental to our health. In the period 2015/16 to 2017/18, there were 4,070 cases of work related illness per 100,000 workers. The rate of workplace injuries has been declining since 2002/03, with 1,920 injuries per 100,000 workers occurring in 2015/16 to 2017/18.
Marmot Indicators updated
Besides indicators related to income, housing and work, PHE’s Wider Determinants tool also includes information on other factors which influence our health, such as education, crime and the natural and built environment.
The tool also groups together the latest data for the ‘Marmot Indicators’. These indicators broadly correspond to the policy recommendations proposed by Sir Michael Marmot in Fair Society, Healthy Lives, the 2010 strategic review of health inequalities in England.