

Public Health England (PHE) is proud to oversee the most comprehensive collection of cancer data in the world.
The National Cancer Registration and Analysis Service (NCRAS) collects data on all cases of cancer in England, which is then used to support public health, healthcare and research.
NCRAS publishes data on new cases of cancer and cancer survival, monitors diagnosis and treatment pathways and looks at trends and geographical patterns to help identify risk factors and potential cancer clusters.
We also work with others in the NHS to assess the quality of care for all individuals treated for cancer.
Partnerships
Working with others is key to making the most of our data. Our partnerships focus on specific areas such as our early diagnosis work with Cancer Research UK, survivorship data with Macmillan Cancer Support, and local intelligence data with the Transforming Cancer Services Team for London.
Here are some of the many ways we are using our analysis and cancer intelligence to help drive improvements in prevention, standards of cancer care and clinical outcomes for cancer patients.
Estimating cancer survival by stage at diagnosis
For the first time, the Office for National Statistics (ONS) and PHE have been able to calculate national 5-year survival by stage of cancer at diagnosis.
Before the latest release, there was limited data available for cancer survival by stage at diagnosis; however the stage at diagnosis has an impact on survival estimates.
How much difference does stage at diagnosis make?
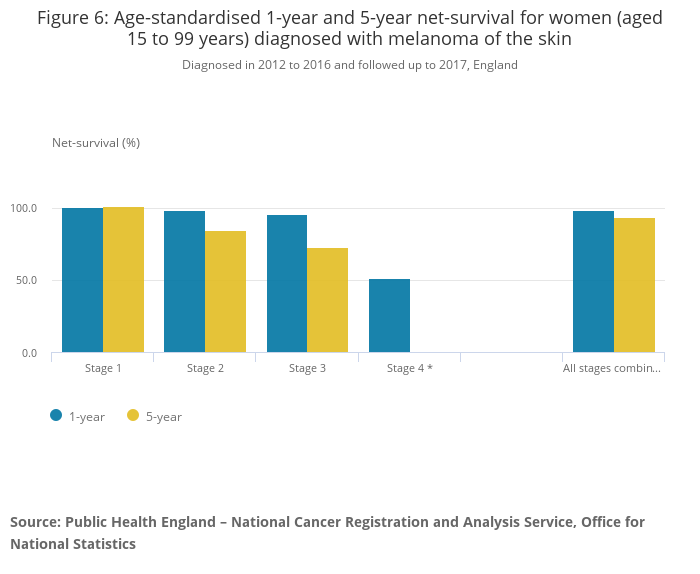
Different cancer sites are affected differently by the stage at diagnosis. Stages of cancer range from 1 (earliest stage) to 4 (latest stage) depending on a number of factors: the tumour size; whether the lymph nodes have cancer cells; or if the cancer has spread to other parts of the body.
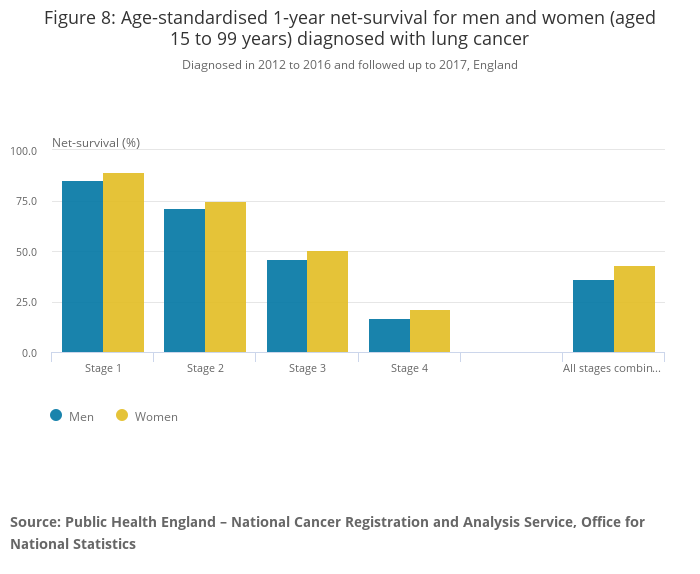
For 1-year survival, males with Hodgkin lymphoma saw the smallest difference across stages, where someone diagnosed in stage 1 has a 96.2% estimate of surviving, compared to 86.7% in stage 4. The largest difference is in lung cancer, where someone diagnosed with stage 1 has an estimated 87.3% chance of surviving 1 year, compared to 18.7% if diagnosed with stage 4.
Where we were able to calculate estimates for 5-year survival, the differences were larger for all cancers except for lung cancer.
The smallest difference is in men with prostate cancer, with those diagnosed in stage 1 having a 100.5% chance of surviving (estimates over 100% mean they have more chance of living 5 years compared to the general population not diagnosed with cancer) compared to a 47.7% chance of surviving 5 years if diagnosed with stage 4.
The largest difference was in women with colorectal cancer, with those diagnosed in stage 1 estimated to have a 95.2% chance of surviving 5 years, compared to 10.7% if diagnosed with stage 4.
How does this help people?
The survival estimates by stage show that patients diagnosed at an earlier stage have a higher chance of surviving up to 1 and 5 years. It also shows that the pattern of stage at diagnosis varies considerably by cancer type – for example some sites (such as breast cancer and melanoma), mainly present early while others (such as stomach and lung cancer) mainly present late.
Together, these show where most improvements in cancer survival can be made by diagnosing patients at an earlier stage.
Routes to Diagnosis: Emergency diagnoses of cancer vary by age, sex, and deprivation
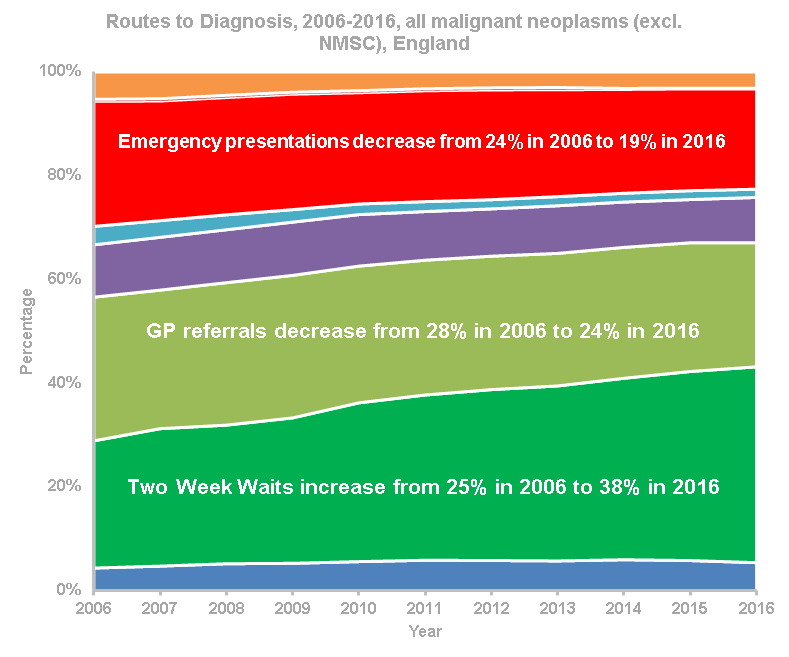
We recently published high-level data on 3 million cancers diagnosed between 2006 and 2016, grouped into eight Routes to Diagnosis.
These define the pathway to a patient’s diagnosis and include cancers detected through screening, referrals from GPs, urgent referrals where a GP suspects symptoms are caused by cancer (known as Two Week Wait referrals) and emergency presentations, such as A&E and emergency GP referrals.
Those presenting as an emergency are more likely to do so with late stage cancer, meaning they have lower survival than those seeking help through a “planned” route.
This reinforces the need for people to come forward as early as possible to maximise their chances of living better with and beyond cancer.
Although the proportion of emergency cancer diagnoses has fallen from 1 in 4 (24%) in 2006 to 1 in 5 (19%) in 2016, the total number has stayed relatively similar and is just under 60,000 diagnoses per year.
There is a steady decrease in the proportion of cases via an emergency GP referral, which may indicate more appropriate use of Two Week Wait referrals.
However, there is a concerning increase in the number of emergency cases diagnosed via A&E, with more than 7,000 extra diagnoses in 2016 compared to 2006. NCRAS is working with academic partners to better understand these different ‘sub-routes’.
Variation by patient characteristics
There is a steady increase in emergency presentations with age: overall, 41% of those aged 85+ are diagnosed as an emergency, compared to 14% of 50-59 year olds. The number of cancers in children, teenagers and young adults is relatively small, but they experience high proportions of emergency diagnoses: 53% of cancers in 0-14 year olds and 26% of cancers in 15-24 year olds.
People in the most deprived areas are more likely to present as an emergency. In 2016, 24% of cancer diagnoses in the most deprived were emergencies, compared to 16% in the least deprived.
Some of this variation is due to the different range of cancers diagnosed in these groups, but it also shows there is more work needed to support earlier diagnosis in deprived areas.
Work still to do
While there are encouraging trends, some cancers still have a high proportion of emergency presentations despite year-on-year reductions in diagnoses. Brain (49%), lung (32%), cancer of unknown primary (55%), acute myeloid leukaemia (54%) and pancreatic cancers (44%) are all most commonly diagnosed as an emergency presentation. While there have been significant reductions in these emergency presentations, there is still work to do to improve their route to diagnosis.
Diagnoses through the Two Week Wait Route increased from 25% in 2006 to 38% in 2016 and this trend shows no signs of slowing.
Other recent work
Cancer emergency presentations
As well as publishing the full Routes to Diagnosis data annually, we also publish a high-level statistical bulletin on cancer emergency presentations quarterly. The latest publication provided CCG and Cancer Alliance level data showed that the proportion of cancer patients who first presented as an emergency continues to slowly fall.
Mortality and survival of 13-24 year olds cancer
In partnership with the Teenage Cancer Trust, we published a report looking at the incidence, mortality and survival of 13-24 year olds with cancer in England. The report showed that cancer survival rates for this age-range are improving, particularly for those with leukaemia and bone cancer.
Cancer services profile
In order to support local cancer care and service planning, we published a short statistical commentary to accompany the 2018 update of the Cancer Services Profile in the Fingertips tool. The indicators provide information on demographics, cancer screening, incidence, Two-Week Wait referrals, diagnostic services, emergency presentations and admissions by GP practice, CCG and at national level.
What’s next?
By overseeing the cancer registry, PHE continues to play a vital role in improving the quality and availability of cancer data, to help improve the lives of cancer patients and their families.
In collaboration with our partners, we will continue to use our world-class data to drive improvements in prevention, standards of cancer care and clinical outcomes.
1 comment
Comment by Jill Clark posted on
Your blog states: "...we are using our analysis and cancer intelligence to help drive improvements in prevention ....". The key causes of cancer are cigarettes, obesity and alcohol. Are any of these going to be reduced as a result of these statistics? Not getting cancer in the first place is a lot more important than 5 year 'survival' statistics.