
 This is the latest in a series of blogs summarising what we learn each time we update the Public Health Outcomes Framework (PHOF).
The PHOF sets out a vision for public health, desired outcomes and the indicators that will help us understand how well public health is being improved and protected.
The outcomes reflect a focus not only on how long people live, but on how well they live at all stages of life.
Today we have published updates for 46 indicators in the tool as well as adding more inequality information to 18 indicators. Full details on everything that has been updated can be found on our indicator updates page.
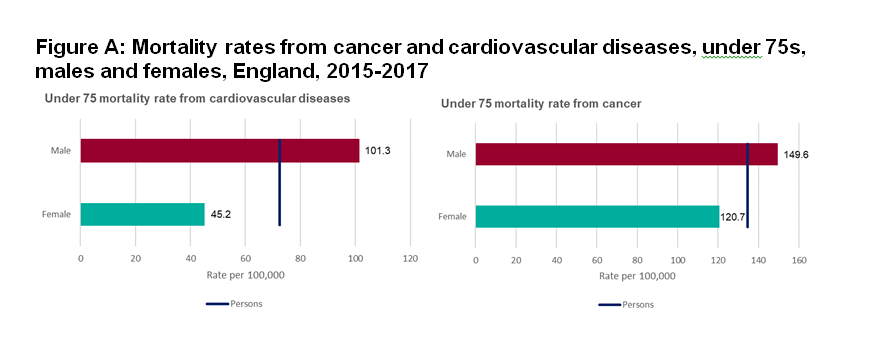
Changes to mortality rates by cause show a mixed picture
We have updated all the mortality rates by specific causes that sit in the healthcare public health and preventing premature mortality domain of the framework, with data for 2015-17. These show a mixed picture.
In 2015-17 the under 75 mortality rates for both cancer and cardiovascular diseases improved for both males and females. However, the rate for males continues to be significantly higher than for females (Figure A).
 In 2015-17 the suicide rate fell significantly in England and is now at its lowest rate since 2010-12. However, the rate for males continues to be higher than for females with over 3,400 deaths a year in males, three times the number of deaths in females.
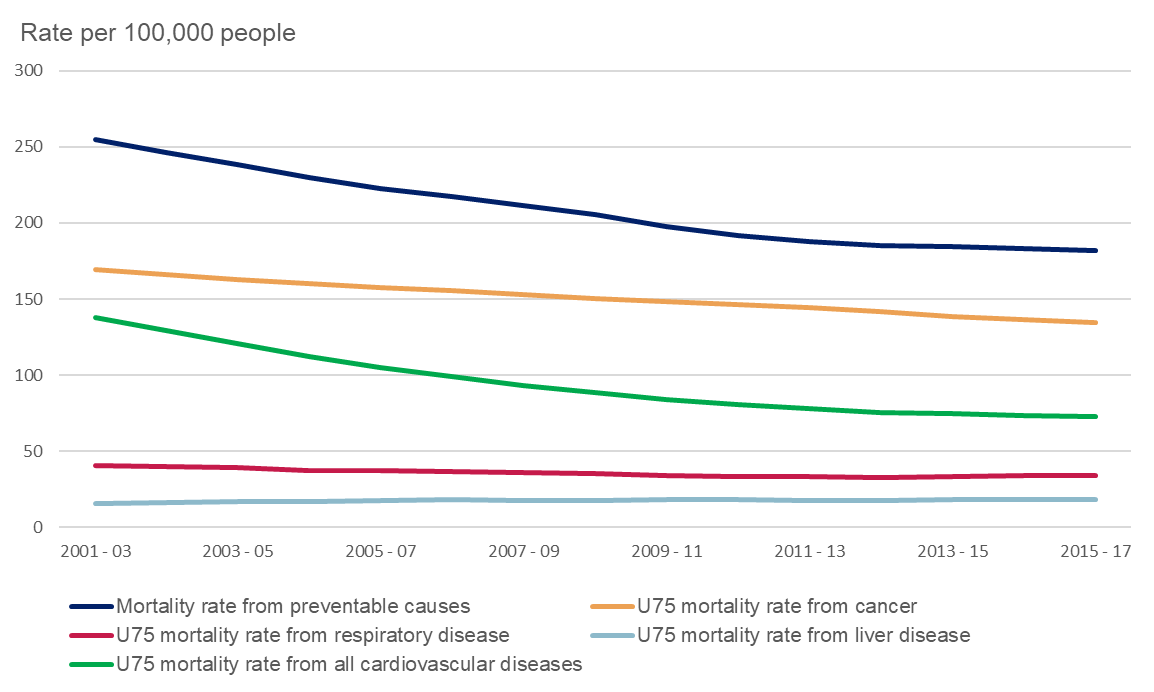
There was no significant change in the England values for the indicators for infant mortality, overall preventable mortality, or for communicable disease mortality between 2014-16 and 2015-17.
The under 75 mortality rates for liver disease and respiratory disease showed slight increases in 2015-17, although they were not statistically significant (Figure B).
Figure B: Mortality rates from preventable causes, cancer in under 75s, cardiovascular diseases in under 75s, liver disease in under 75s, and respiratory disease in under 75s, persons, England, between 2001-03 and 2015-2017
Increase in engagement in substance misuse treatment following release from prison; small changes in completion of treatment in the general population
Using data from the National Drug Treatment Monitoring System, we measure whether adults who leave prison with a substance misuse treatment need go on to start treatment in the community.
The proportion who started treatment in the community within 21 days of release in 2017/18 was 32.1% in England. This was a significant improvement from 30.3% in both 2016/17 and 2015/16.
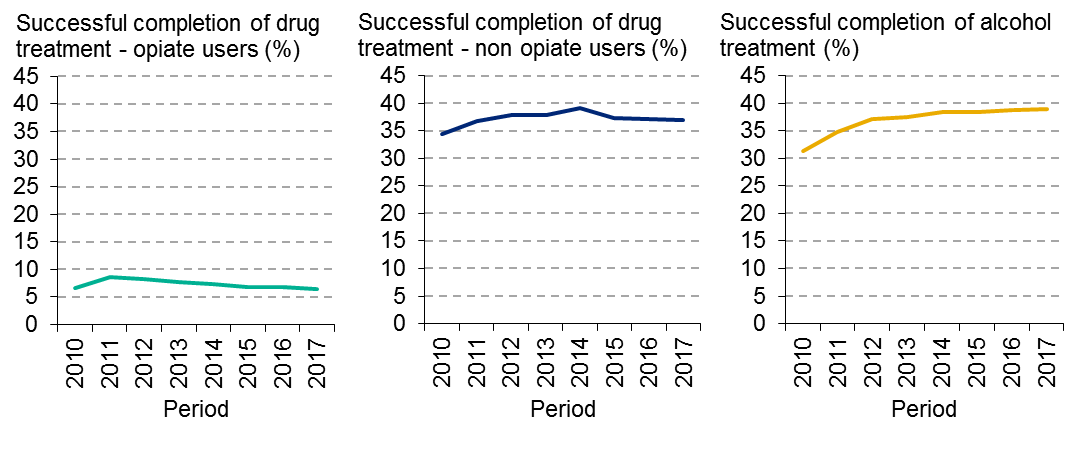
We also report the percentage of users in the general population that successfully complete treatment for drug and alcohol use and do not re-present for treatment within six months. The most recent time points for 2017 do not show statistically significant changes compared to 2016 for these indicators.
The percentage of successful treatment decreased slightly for opiate (6.5%) and non-opiate users (36.9%) and increased slightly for treatment related to alcohol (38.9%).The statistical trend based on the most recent five time points is decreasing (getting worse) for successful treatment of both opiate, and non-opiate users, whilst it is increasing (getting better) for successful alcohol treatment.
Figure C: Successful completion of treatment for opiate, non-opiates, and alcohol, 18+, England, 2010 to 2017
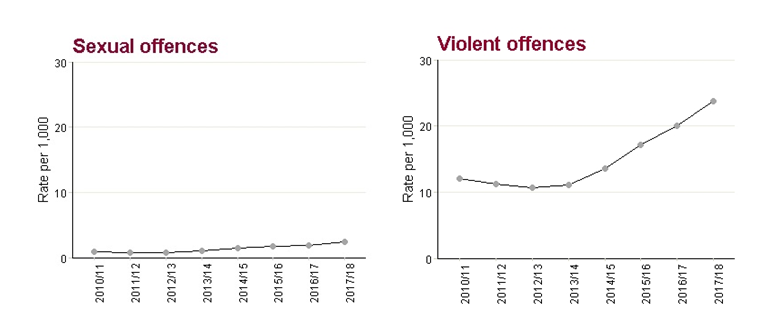
Rise in the reported rate of violent and sexual offences
Both the rates of reported violent and sexually violent offences have significantly increased in 2017/18. This is a continuation of the trend for both indicators which have been rising since 2013/14.
In 2017/18, the rate of violent offences was 23.7 per 1,000 people, and the rate of sexual offences was 2.4 per 1,000 people. For both indicators there are higher rates of offences in the most deprived areas than the least deprived.
These data must be interpreted with caution as it is difficult to determine whether high or low levels of violent offences are due to high or low incidence of offences taking place, or due to differing levels of reporting. This is why we do not show an increase in these indicators as an improvement or deterioration in outcomes.
Figure D: Crude rate of offences per 1,000 population, 18+, England, 2010/11 to 2017/18
If you’d like to view the data for your local area, visit our webtool at www.phoutcomes.info, and if you’d like to send us any feedback please do so via phof.enquiries@phe.gov.uk.
2 comments
Comment by Dr Michael C Watson posted on
Should we have more positive health indicators?
e.g. Number of health promoting schools
e.g. Number of health promoting hospitals
e.g. Percentage of children undertaking enough exercise per week
e.g. Percentage of homes with a working smoke alarm
Focus on health?
https://www.bmj.com/content/347/bmj.f4210
Comment by Zoya posted on
Hi, i am Zoya i am 23 years old girl i am very happy to say that this is very help full to me thank you so much to shearing this post...