
This is the latest in a series of blogs summarising what we learn each time we update the Public Health Outcomes Framework (PHOF).
The PHOF sets out a vision for public health, desired outcomes and the indicators that will help us understand how well public health is being improved and protected.
The outcomes reflect a focus not only on how long people live, but on how well they live at all stages of life.
Today we have published updates for 11 indicators in the tool as well as adding more inequality information to 12 indicators. Full details on everything that has been updated can be found on our indicator updates page.
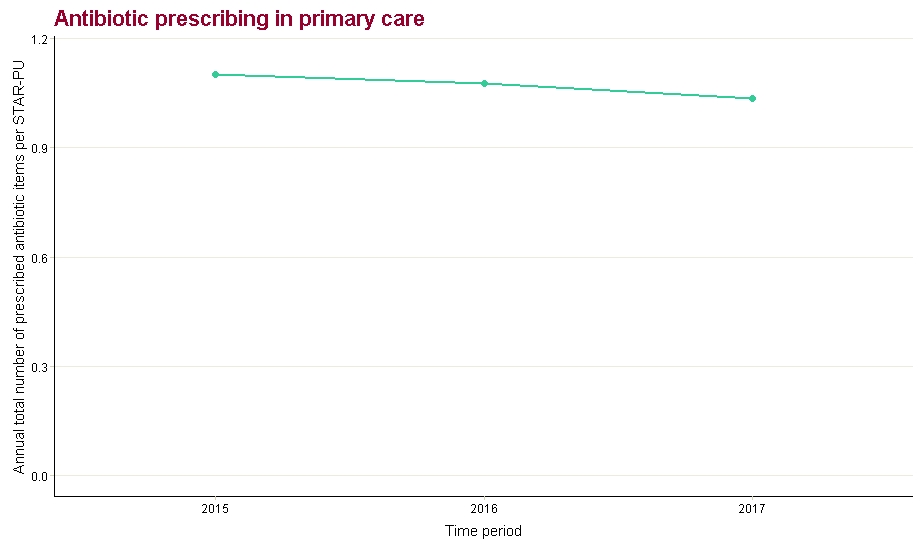
Antibiotic prescribing in primary care by the NHS has decreased
Antibiotic prescribing in primary care by the NHS was 1.04 items per STAR-PU (Specific Therapeutic group Age-sex Related Prescribing Unit) in 2017, a reduction from 1.08 items per STAR-PU in 2016. STAR-PU is an adjusted rate that removes confounding effects of age and sex in the comparison of prescribing between different geographical areas. This method allows for more accurate comparison of prescribing. The aim is to reduce antibiotic use, as overuse and incorrect use are major drivers of antimicrobial resistance (AMR).
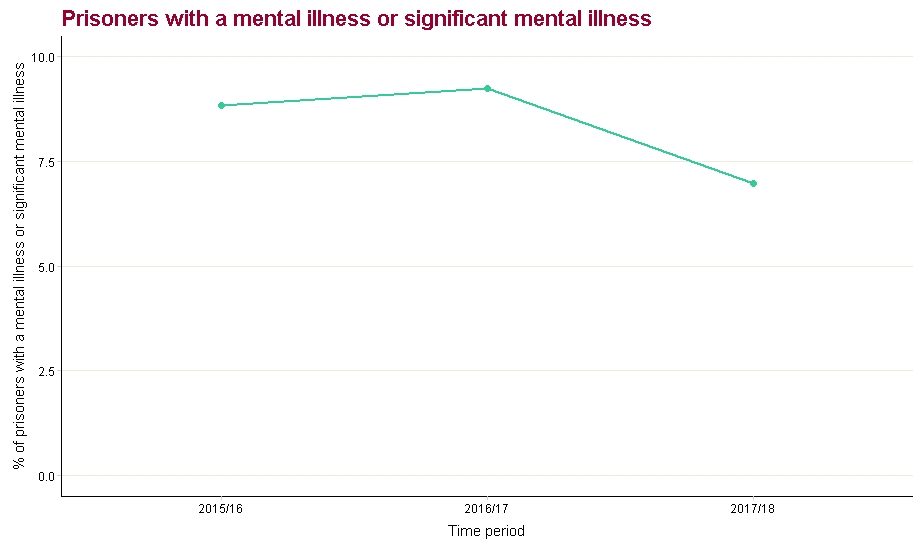
Reduction in proportion of prisoners with mental illness or significant mental illness
The percentage of prisoners who had a mental illness or significant mental illness (aged over 18) decreased in 2017/18 to 6.98%, compared with the previous year’s 9.24%.
This indicator is only available at England level.
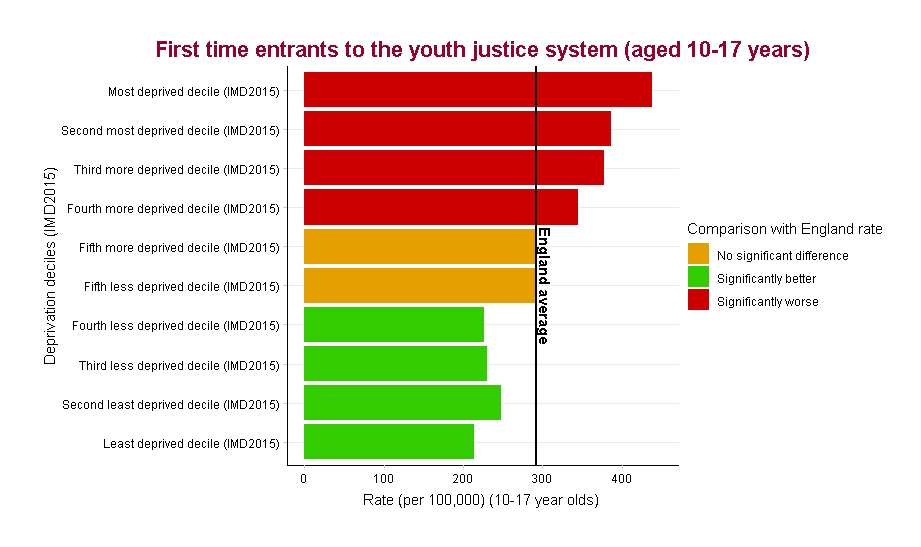
Reduction in both first time entrants to the youth justice system and first time offenders
The rate of first time entrants to the youth justice system (aged 10-17) decreased to 292.5 per 100,000 in 2017, from 331.0 per 100,000 in the previous year. Similarly, the rate of first time offenders decreased to 166.4 per 100,000, compared with the previous year (218.4 per 100,000 in 2016). Both values reduced compared with the previous year and these reflect the longer term decreasing trend based on the five most recent time points.
Both these indicators show variation by deprivation and show that the most deprived deciles had higher rates than the least deprived deciles.
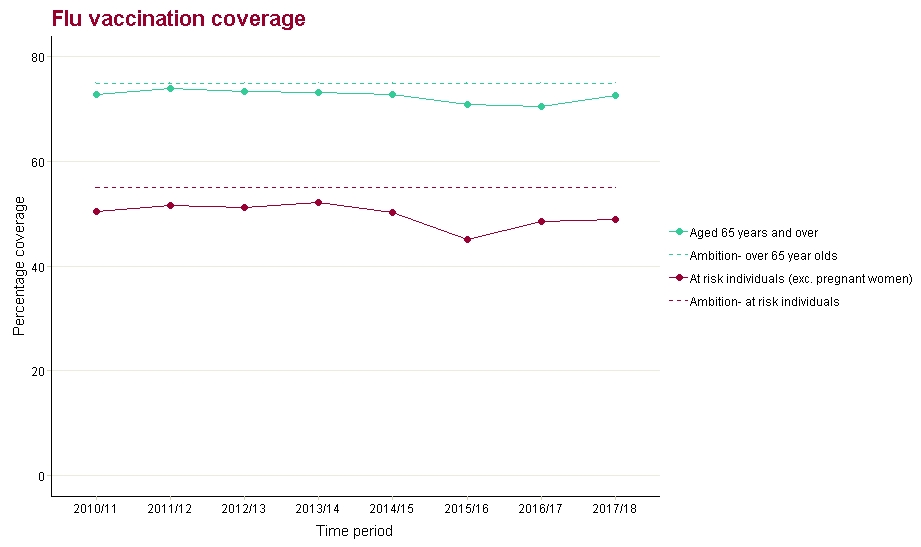
Uptake in flu vaccinations increased in older people (aged 65+) and individuals at risk, and a new indicator definition has been published for children (aged two to three years)
The percentage uptake for flu vaccination in adults aged 65 and over rose to 72.6% in 2017/18, an increase compared with 70.5% in 2016/17. However, this value remains lower than the government ambition of 75% uptake for this group. Vaccine uptake has tended to fluctuate around the 70% level in recent years.
Similarly the percentage uptake in at risk individuals (aged six months to under 65 years, excluding pregnant women) increased compared with 2016/17, rising from 48.6% to 48.9% in 2017/18. However, this was short of the ambition of 55% uptake for this group. Vaccine uptake in this group has tended to fluctuate around the 50% level. Close monitoring across all the target groups will continue.
Flu vaccination coverage in children aged two to three years old is a new indicator definition. This replaces the previous indicator which also included children aged four. In 2017/18, children aged four (in school year reception and aged four to five years old) were offered vaccination as part of the schools delivery programme instead of in a GP setting. Uptake in children aged two to three years (combined) was 43.5% in 2017/18.
If you’d like to view the data for your local area, visit our webtool at www.phoutcomes.info, and if you’d like to send us any feedback please do so via phof.enquiries@phe.gov.uk.