
We are often asked why the data we publish in the Public Health Outcomes Framework (PHOF) webtool is not current.
For example, in early 2018, why is 2015 the latest data we have available on under 18 conceptions and 2016 the latest for mortality?
This blog explains the journey from an event taking place, to the data becoming available on our Fingertips webtool. We’ll use the example of hospital admissions as well as referencing other data sources we use.
The indicators in the PHOF come from a variety of sources – some we calculate within Public Health England from record-level data, while others are published by others and simply added straight into the PHOF.
How does the data collection phase work?
PHOF indicators capture a number of events of interest – whether these are births, people responding to a survey, people being admitted to hospital or deaths – and relate these to the population of a local authority,. These events are formally recorded in lots of different ways.
For example, births and deaths are registered at a register office, which must be done within 42 days of a birth, and five days of a death. Registrars record these on an online system, and the Office for National Statistics (ONS) receives details of registrations on a daily basis. This information feeds into annual national data files of registrations within a calendar year.
When an organisation runs a survey, they collect the responses on their systems and there may be some time required for data entry depending on the survey collection method (such as paper-based or telephone collections).
Our indicators of hospital activity are taken from the Hospital Episode Statistics (HES) inpatient data, which are compiled by NHS Digital. They clean and check the data submitted by healthcare providers to the Secondary Uses Service (SUS), and make the final form of the data for a financial year available in HES, usually in the autumn after the end of the financial year in question.
There are also many other collections of data that lead to indicators appearing in the PHOF, for example data on smoking in pregnancy is collected and published by NHS Digital, or pupil absence statistics published by the Department for Education from the School Census.
PHE also collects some data, including cancer registrations, and health protection data, as well as NHS Health Checks and some screening data.
For indicators that we take directly from other government departments, such as homelessness statistics or road accident statistics, we are completely dependent on their processes, which can include delays to making data public.
How does data sharing work?
To access data from other organisations like ONS or NHS Digital, PHE has agreements in place. This allows us to receive the datasets that we require to calculate indicators. We receive birth and death registrations in the summer, and HES in the autumn.
How do we turn data into useful, quality assured indicators?
Before they can be added to the framework, all indicators need to be calculated and checked to make sure they are of a high standard.
To ensure indicators have a robust definition and are accurately measuring what they claim, PHE has an Indicator Methodology Review Group that reviews and signs them off.
The tools we use for producing indicators depend on the data we have.
With indicators that are already produced by other government departments, we often add what are known as ‘confidence intervals’ which allow us to assess whether an indicator value for an area is statistically significantly different from the England value, or higher or lower than the previous year’s values.
We calculate these for as many indicators as we can, to allow us to produce the red-amber-green (RAG) rating you see on the . This means the indicators can show at a glance what is really happening in the health of the population in one particular area.
All calculations must be carefully checked before the indicator is uploaded.
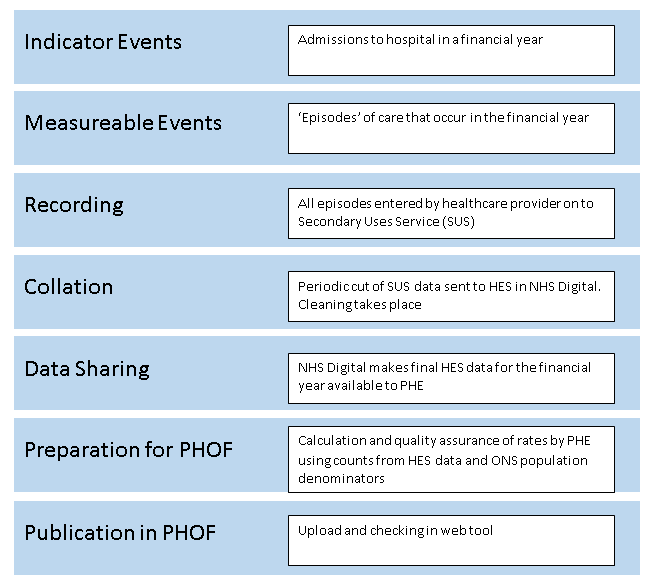
Once uploaded, the indicators are checked in the webtool itself to check they are displaying correctly. The full process is outlined in the flowchart below.
How is publication of data scheduled?
The PHOF webtool is official statistics, which means it has a set pre-announced release schedule. For PHOF this is quarterly in February, May, August and November. Based on what we know about the timescales outlined earlier in this blog, we have a provisional list of indicators that we expect to appear in each update.
This appears on the PHOF webtool, but it is only provisional as there are sometimes unforeseen delays in receipt of data that mean we can’t meet that timetable. We add a final list of indicators for each update to gov.uk as soon as we know what that list is.
In response to feedback from users, we have also now started to update indicators that appear in other PHE official statistics products as and when they are updated, rather than waiting for the next available PHOF update. This means that different fingertips products should no longer be out of sync with each other.
We hope you have found this summary useful in explaining why data don’t always appear in the PHOF webtool immediately.
We’d of course been keen to hear any feedback on this blog or on the PHOF in general to our enquiries inbox at phof.enquiries@phe.gov.uk.
8 comments
Comment by Dr Mary E Black posted on
This is one of those very useful, factual, explanations that every public health person should read. It describes the careful process used to make sure data is reliable and trusted. We can imagine a different world where date is current or 'live', but that is a different kind of data and will for the foreseeable future be an adjunct to official statistics.
The slow and steady work that is put into PHOF and Fingertips is not glamorous, but essential and I believe that those who work on it are the unsung hero(ines) of public health. In an age of fake news and sloppy half truths it really matters that this data is published and made available for all to see and use.
Comment by Clare Griffiths posted on
Thank you for your generous comment!
Comment by Mohammed A posted on
Thanks for sharing this valuable information: data collation based on is defined public health indicators. In deed, well-informed public health decision mainly based on quality and timely data from a reliable source as well as using r commonly understandable indicators. Hence, this framework is very important toward improving public health comes and saving lives.
Comment by Nicholas Hicks posted on
I completely echo Mary's comments. The products, PHOF and Fingertips, and invaluable... and, I think, a grossly underused resource. I wonder if more effort should be put into promoting an understanding and the use of these data and tools in the wider NHS, local government and among non-professional users.
Comment by Alison Brown posted on
Very useful. Increasingly we need to communicate complex financial and statistical information to patients, public and staff. Be good if we could help our communicators to understand and translate this sort of information into accessible formats and language.
I'd like to get in touch with the Justine Fitzpatrick and the team. Is there an email address or phone number?
Comment by Helen Buttivant posted on
I totally support the comments above. I think these resources are an immensely valuable yet completely underused asset. Just today I emailed a link to the Fingertips website to a colleague in a CCG Performance Department who responded by saying she had never seen the website before! I think a little further investment in promoting understanding and potential uses for the resource would be money extremely well spent.
Comment by Greg Fell posted on
Agree with the other comments
Everyone likes a good whine that "the data is not up to date". This short blog eruditely explains why
It is essential knowledge all PH professionals should have
Comment by Ali Wilson posted on
Many thanks for this - it is really useful. We are often asked about data and in particular time delays by Officers and Members so this is really useful to be able to refer to.