
This is the latest in a series of blogs summarising what we learn each time we update the Public Health Outcomes Framework (PHOF).
The PHOF sets out a vision for public health, desired outcomes and the indicators that will help us understand how well public health is being improved and protected.
The outcomes reflect a focus not only on how long people live, but on how well they live at all stages of life.
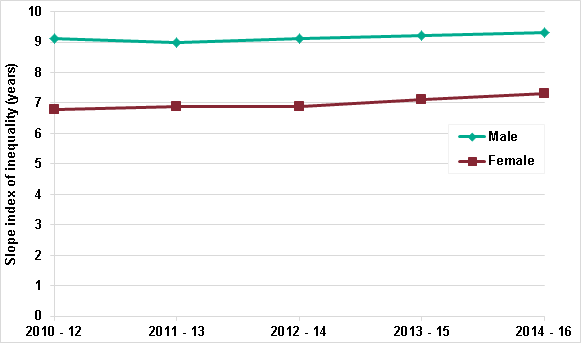
Inequality in life expectancy has widened
The latest data in the PHOF for 2014-16 indicate a widening in inequality in life expectancy within England since 2010-12, but this is statistically significant for females only. Inequality in life expectancy in the PHOF is estimated using a summary measure called the slope index of inequality (SII). The higher the value of the SII, the greater the inequality within an area.
The SII for male life expectancy in England in 2014-16 was 9.3 years, greater than 2013-15 (9.2 years), and 2010-12 (9.1 years). For females, the SII for life expectancy at birth was 7.3 years in 2014-16, greater than 2013-15 (7.1 years), and significantly greater than 2010-12 (6.8 years).
Of the 149 upper tier local authorities in England for which local inequality is measured, 65 had a narrowing of inequality for males between 2010-12 and 2014-16, and 84 had a widening. For females, inequality narrowed in 45 local authorities and widened in 104. However, these findings are not all statistically significant.
An indicator of inequality in life expectancy at age 65 has been added to the PHOF for the first time in this update. The SII for males in 2014-16 was 4.8 years, and there has been no significant change since 2010-12. But inequality in female life expectancy at age 65 has increased in all four time periods since 2010-12. In 2014-16 it was 4.4 years, significantly higher than the 4.0 years in 2010-12.
Life expectancy and healthy life expectancy remain relatively stable
The latest data from ONS, which is now included in the PHOF, shows that life expectancy at birth for England as a whole remained the same in 2014-16 as in 2013-15 for both sexes: 79.5 years for males and 83.1 years for females. Alongside this female life expectancy at age 65 also remained the same (21.1 years), but there was a small increase for males from 18.7 years in 2013-15 to 18.8 in 2014-16.
Latest data for 2014-16 indicates a fall in healthy life expectancy in England for both sexes. For males, it fell to 63.3 years, having been 63.4 years in the previous two time periods. For females, it fell to 63.9 years, from 64.1 years in 2013-15. For neither sex were these falls statistically significant, however.
Child health improved across a range of indicators
Of babies born at full term in 2016, 2.8% had a low birth weight of under 2,500g. This was the same percentage as 2015 and represents just under 16,800 births. When looking at the longer term trend (over the last 8 years), the percentage has reduced significantly.
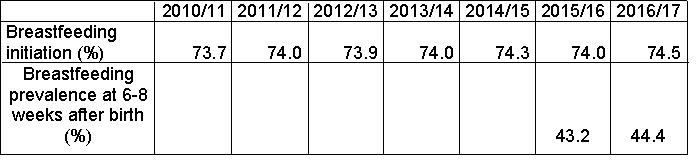
The percentage of mothers who breastfed after delivery, and the percentage still breastfeeding at 6 to 8 weeks, both increased in 2016/17 to 74.5% and 44.4% respectively.
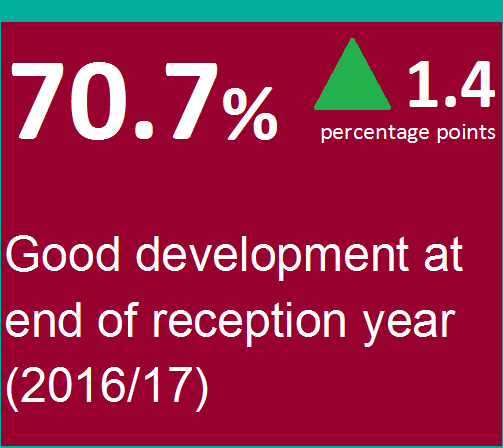
70.7% of children achieved a good level of development at the end of their reception year in 2016/17, which was an increase from 2015/16.
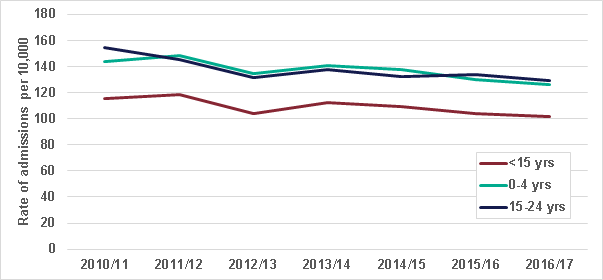
Rates of children and young people aged under 25 admitted to hospital for unintentional and deliberate injuries decreased in 2016/17.
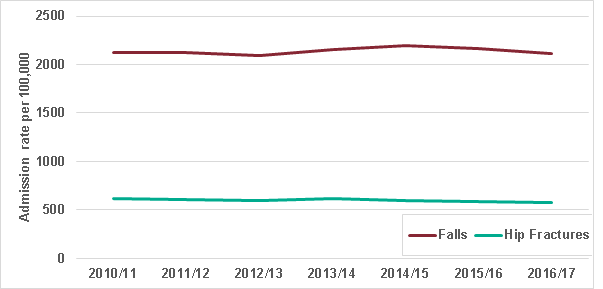
Improvement in outcomes for older people, including admissions for hip fractures and falls
Health related quality of life in those aged 65 and over improved in 2016/17 compared with the previous period. This measure is calculated using responses to survey questions which cover 5 dimensions: mobility, self-care, usual activities, pain/discomfort and anxiety/depression.
Alongside this, the rate of falls and hip fractures resulting in an emergency hospital admission for those aged 65 and over reduced in 2016/17 compared with the previous year.
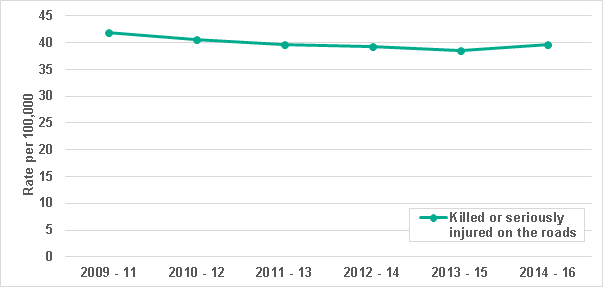
Increase in people killed or seriously injured on the roads, but reduction in hospital admissions related to alcohol and self-harm
In England, the rate of killed and seriously injured on the roads increased from 38.5 per 100,000 in 2013-15 to 39.7 per 100,000 in 2014-16. This was over 21,700 casualties per year in 2014-16.
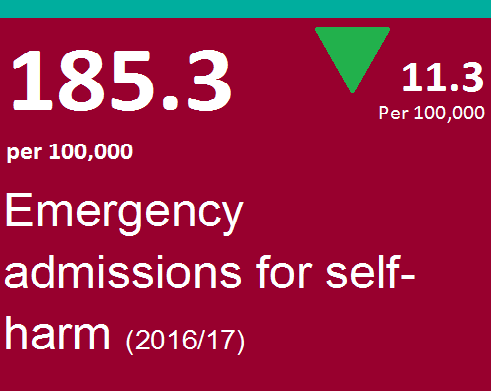
The rate of people being admitted to hospital due to alcohol-related conditions decreased in 2016/17, to a rate of 636 per 100,000 population. The rate of people admitted to hospital for self-harm decreased in 2016/17. The rate was 185 per 100,000 population, which represents just under 104,000 emergency admissions.
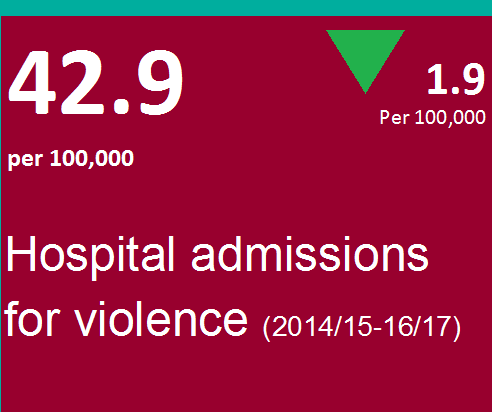
Reduction in hospital admissions for violence, but increase in reported violent crimes
The rate of hospital admissions for violence decreased from 44.8 per 100,000 in 2013/14-15/16, to 42.9 per 100,000 in 2014/15-16/17. However, this was still over 24,000 admissions per year.
Rates of reported violent crime and sexual offences both increased in 2016/17 compared with 2015/16. It is not possible to say whether these increases are due to an increase in the number of violent crimes or through an increase in reporting to the police.
If you’d like to view the data for your local area, visit our webtool at www.phoutcomes.info, and if you’d like to send us any feedback please do so via phof.enquiries@phe.gov.uk.
1 comment
Comment by Mohammed A posted on
Thanks for sharing this valuable public health update!