
Have you used our Health Profiles to learn more about your area or inform your planning?
For 10 years these reports – one for every local authority in England – have acted as conversation starters highlighting issues that can affect health in each locality.
The first profiles were published in 2006 and were developed in response to the 2004 report ‘Securing Good health for the whole population’ by Derek Wanless.
Wanless highlighted the need for high quality data to help professionals evaluate the effectiveness of their health interventions but went on to criticise the fact that this wasn’t readily available.
So Health Profiles were introduced as part of the response to the report and they set out with a brief to provide:
- a consistent, concise, comparable and balanced overview of the population’s health that informs local needs assessment, policy, planning, performance management, surveillance and practice
- to be primarily of use to joint efforts between local government and the health service to improve health and reduce health inequalities, but ultimately to empower the wider community
The first Profiles included an indicator set for the local authority areas in England (county, district and unitary), comparisons with the local region and England, a spine chart health summary, analysis of health inequalities and trends, along with interpretation and key messages.
Ten years later and - although the public health landscape has changed dramatically - the core objective for the Profiles hasn’t.
We still want these snapshot views of local issues to prompt important conversations amongst local authority members or within Health and Wellbeing Boards, helping professionals invest their time and money in the interventions that can have the greatest impact.
A number of topics have been included in the Profiles since 2006. For example, indicators relating to GCSE achievement, smoking in pregnancy, estimates of adult smoking prevalence and physical activity (amongst others) have appeared in every publication.
But many have been subject to changes in definition or new data sources which mean that comparisons over time (between profiles) should not be undertaken.
The popularity of data tools
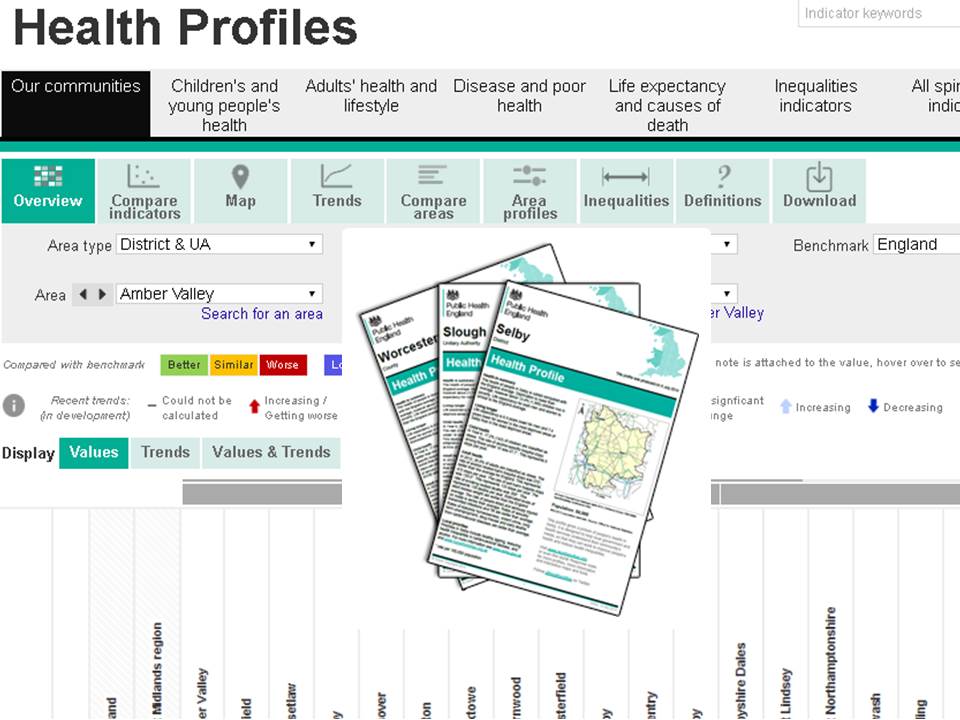
Since their launch we’ve seen nearly 7 million downloads of the Health Profiles PDF reports and they remain popular, but over time they have been supplemented with additional interactive tools.
These include a Health Profiles specific website which includes presentation of the data within the profiles using interactive mapping software.
The use of our data presentation platform to create the Health Profiles online tool has provided new ways to visualise and compare the indicators.
Responding to your feedback
We consult our users before making any changes to the Health Profiles and in May 2016 we ran an online user consultation, resulting in a number of changes to the 2016 Health Profiles, details of which were published on our website.
Over the years there have been a number of presentation updates and the inclusion of indicators on important topics - such as mental health – all as a result of feedback from our users.
The most common request we received was from local councillors who needed data at a sub local authority level. This would primarily enable them to identify inequalities within their areas. The Local Health Tool was developed to meet this need.
Local Health provides data for small areas within local authorities. It offers interactive map generation at various geographical levels, including:
- Wards
- Middle layer super output areas (MSOAs)
- Local authorities
- Clinical commissioning groups
- Sustainability and transformation plans (STPs)
- Parliamentary constituencies
The tool has received positive feedback and was last updated in September 2016.
Case study: Using Health Profiles to look at trends
Teenage conceptions are a public health success story. The reduction in rates of conceptions to girls aged under18 can be well illustrated using the Health Profiles.
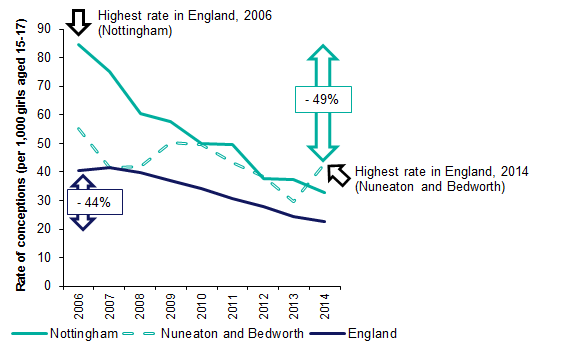
The chart above shows the reductions in the rate that have occurred between 2006 and 2014. The overall rate for England reduced by 44%, which equates to nearly 18,000 teenage conceptions.
Nottingham had the highest rate in England in 2006 which reduced significantly (by 61%) by 2014.
Nuneaton and Bedworth started with a lower rate in 2006 but in 2014 was the area with the highest rate. Although the rate in 2014 was lower it was not significantly different from the rate in 2006 (largely due to an increase in the rate between 2013 and 2014).
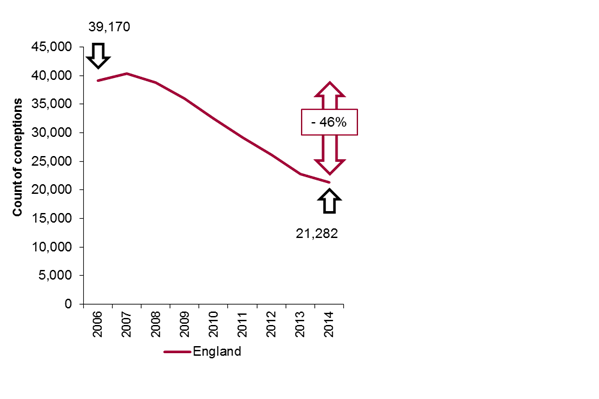
The number of teenage conceptions in England have almost halved from 2006 to 2014. Just over 39,000 conceptions in 2006 reduced to just over 21,000 over the time span.
Whilst the overall trends for this indicator are of a downward trajectory, this is not the case for every authority. You can use the Health Profiles to gain an at-a-glance idea of how the change in rate in your local area compares with other authorities and where it sits regionally and nationally.
Other tools can be used to delve deeper into the different topics, for example you could access the Teenage conceptions knowledge hub or the Sexual & Reproductive Health Profiles for more information on teenage conceptions and related indicators.
The future of Health Profiles
With your help – users of the Health Profiles – we continue to review and reflect on how well our data tools are meeting your needs.
We’re looking at how best to embrace new technologies and techniques in data visualisation whilst data transparency, big data and new emerging sources of data need to be explored.
We value your feedback – if you have comments on our data tools or have ideas about new data you’d like to be able to access, please get in touch via the comments below or email us at healthprofiles@phe.gov.uk.
1 comment
Comment by Abaya posted on
This is such an important topic that needs more exposure.
Has there been any updated studies?
Ive read this one:
https://www.gov.uk/government/publications/health-profile-for-england/chapter-6-social-determinants-of-health