
This time last year I wrote about some of the data tools PHE produces to help local authorities, the NHS and others improve the nation’s health and reduce health inequality.
We make many of these available via the updated GOV.UK data gateway, which exemplifies the sheer range of data, topics and users we deal with. The challenge to simplify this remains and we are continuing to improve the experience for our users.
As part of this effort, we have developed the Fingertips platform which delivers a range of health profiles, the Public Health Outcomes Framework, Tobacco Profiles, and Healthier Lives. They remain popular and their use is growing.
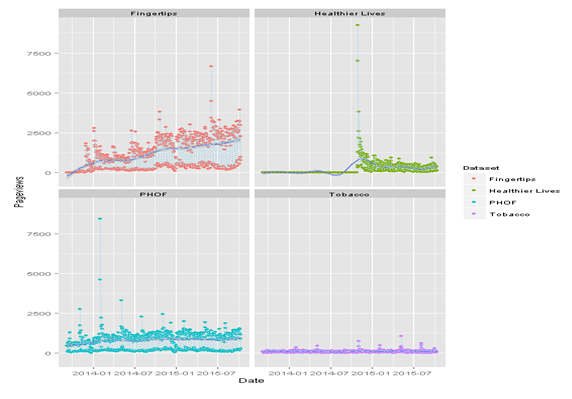
Average daily hits for selected PHE knowledge and intelligence resources, Sept 2014 – Oct 2015. Healthier Lives statistics since January 2015
As Fingertips has grown, it has become more complex, and for this blog we have created a tool to help people more easily see what indicators are available, which profile they are in, and what population unit (eg local authority, CCG, PHE centre) they are available for.
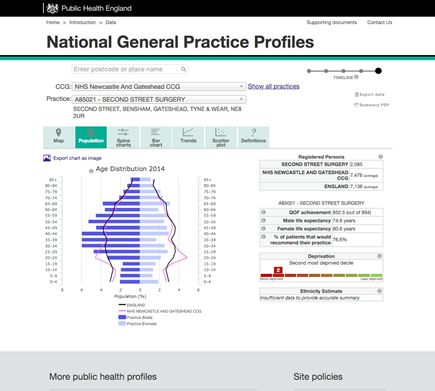
Benchmarking general practices
Our GP profiles are a huge resource. They contain over 200 indicators of health and care for the majority of general practices in England.
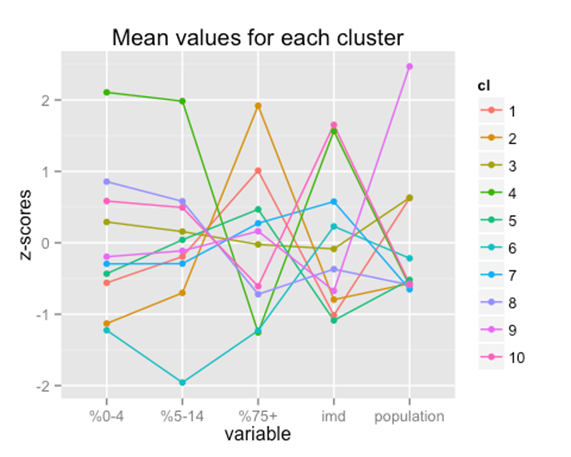
There are around 8,000 practices with very different registered populations. If we want to compare practices it doesn’t make sense to compare all 8,000 so we needed to find a way of categorising them into smaller groups. We could print off the population charts for all 8,000 and try and do it by eye, or we could analyse the data and see what it says.
One approach is to use cluster analysis which is a form of unsupervised machine learning. For example if we split practices into 10 groups based on practice size, age, and deprivation we get the figure below. This is known as a parallel coordinate plot and shows the deviation of each group from the average for each demographic variable. We can see that there are practices with much larger populations than average which tend to be less deprived and have ‘standard’ age distributions.
Why does it matter? Given the strong association of many health outcomes and care processes with age and deprivation it is important to make allowances for both when making comparison. Most data currently produced for general practices makes no adjustment for either.
Atypical age distribution:
This week you'll see more blogs and social media activity discussing health data and the range of data tools available for professionals. Please do engage with #PHEdataweek. We are on hand to answer questions and build new relationships.