
 Since life expectancy was first measured in the mid-19th century the trend in England has been of continued increase, interrupted only by the World Wars. Despite this, people in some areas of the country are still not living nearly as long as others and in recent years we have seen very little change in this inequality.
These inequalities in life expectancy are closely associated with levels of deprivation. Differences in life expectancy between areas are being measured in the Public Health Outcomes Framework data tool using a measure of socio-economic inequality called the slope index of inequality (SII). The national SII measure is calculated by dividing England into 10 groups, with the most deprived tenth of the population in the first group, the second most deprived tenth in the second group and so on, with the least deprived tenth of the population in group 10.
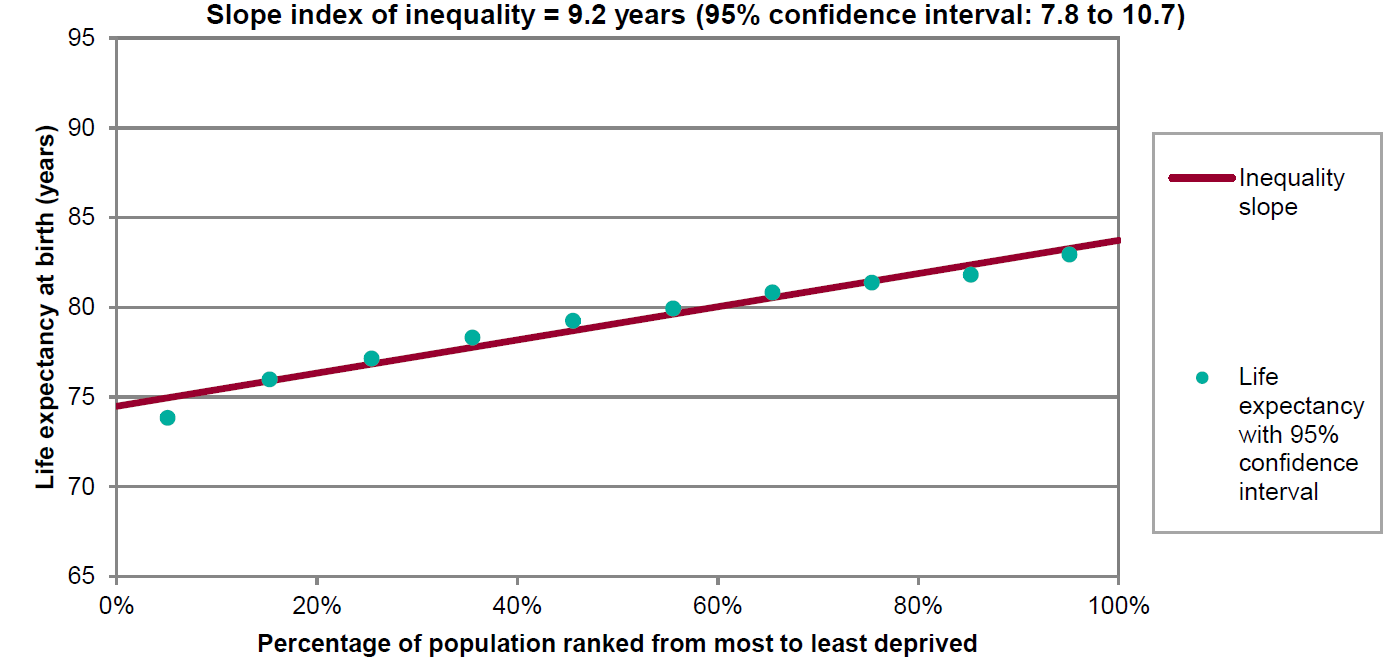
Male life expectancy in each of the 10 groups (‘deprivation deciles’) in England is shown in Figure 1. This shows a very clear gradient: the lower the deprivation level, the higher the life expectancy. The slope index of inequality is calculated from the red regression line on the chart - it is simply the difference between the life expectancy at the top of the line and life expectancy at the bottom of the line. A similar chart can be drawn for female life expectancy. The SII represents the range in years of life expectancy across the social gradient, from most to least deprived: the higher the SII, the greater the inequality.
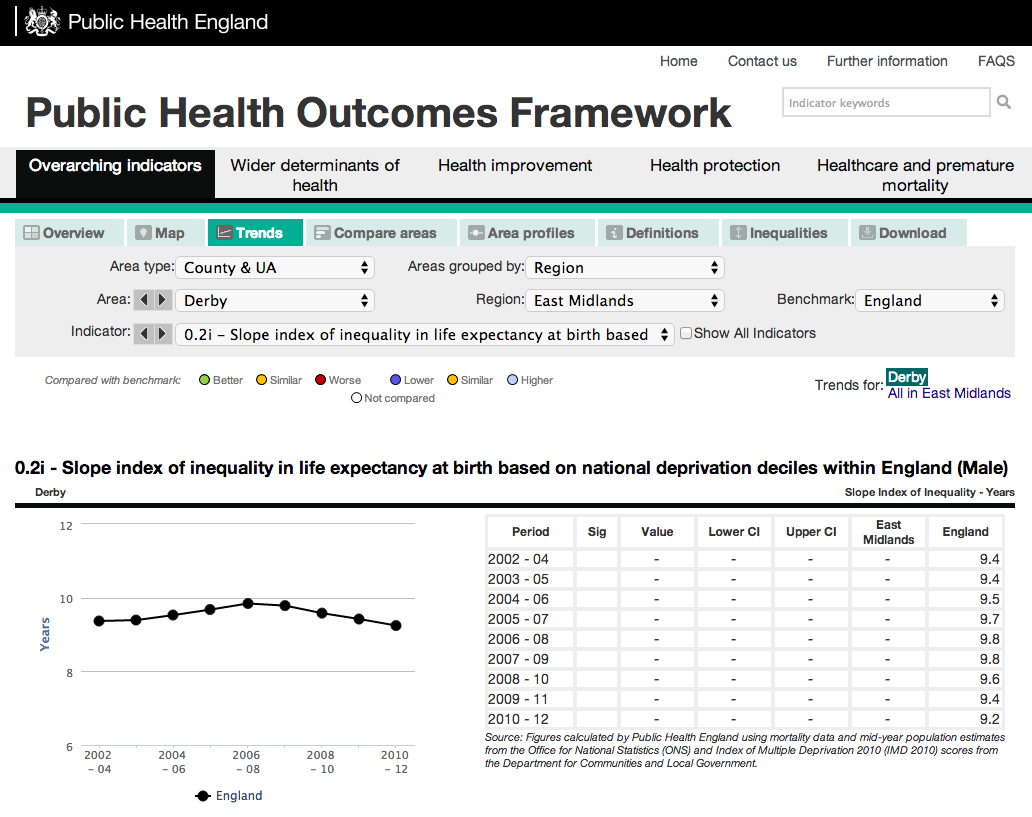
The Public Health Outcomes Framework data tool contains trends in life expectancy and the slope index of inequality from 2002-04 to 2010-12. This provides information on how inequalities in life expectancy in England have been changing. Between 2002-04 and 2010-12, life expectancy increased in all deprivation deciles. For males, the increase in life expectancy in the most deprived two deciles was greater than in the least deprived two deciles (Table 1). For females, the biggest increase in life expectancy was in the least deprived two deciles, greater than the increase in more deprived deciles. Differences in the increase between deprivation deciles will influence how the SII in life expectancy has changed over time for both sexes.

Source: Public Health Outcomes Framework data tool
The slope index of inequality for males in 2010-12 was 9.2 years. This is slightly lower than the SII of 9.4 years in 2002-04 (Figure 2). This reflects the slightly greater increases in life expectancy seen in the most deprived as opposed to the least deprived deciles.
The slope index of inequality for females in 2010-12 was 6.8 years, slightly higher than the SII of 6.4 years in 2002-04 (Figure 2). This reflects the slightly greater increases in life expectancy seen in the least deprived deciles. However, for both males and females, these changes in the SII over time were not statistically significant.
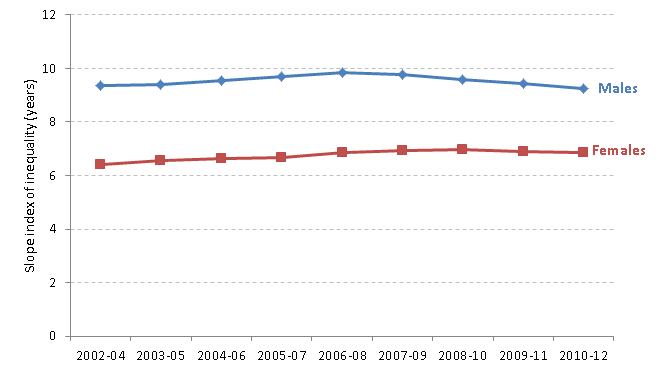
Source: Public Health Outcomes Framework data tool
To summarise, the data in Table 1 and Figure 2 show that life expectancy in recent years has increased across the whole population of England in all deprivation deciles, but there has been little change in inequality across the social gradient. There is much more work to be done. PHE is supporting local areas to act on some of the recommendations of the Marmot Review, Fair Society, Healthy Lives. We are focussing on the biggest preventable causes of premature death. PHE is now building an inequality focus into each of its major programmes of work, such as tobacco, early years and Health Checks programmes.
We will continue to report annually in the PHOF data tool on life expectancy, providing evidence as to whether the challenging aim of reducing inequalities between communities is being met.
If you want to find out more details of how the SII is calculated, please see the technical user guide for all of the overarching indicators within the Public Health Outcomes Framework.
4 comments
Comment by Bren posted on
Hello Charlotte, Allan and Justine,
Thanks so much for the information contained in the blog and the reference to the slope index of inequality (SII). The aspect I personally remember from the many areas identifying the inequalities difference is the gradient which may/may not be the same as the SII?
I think it is hugely important to remind us of the data, and the tools, however, it is the interventions and measured outcomes that we need the most. Combined with the collective information we can achieve much more, and ultimately serve better the people and communities who's life expectancy is clearly apparent.
I am conscious inequalities is, and will be, a complex area and therefore one most definitely worthy of continued and acutely focused attention.
Best wishes and thank you for the great blog.
Best wishes,
Bren.
Comment by Charlotte Fellows posted on
Hello Bren,
Thank you for your comments on the blog.
The slope index of inequality (SII) is a summary measure of gradient of inequality. The results in the PHOF summarise the gradient in life expectancy from most to least deprived areas within each local authority. There are a number of summary measures of inequality, but the SII was the preferred method for reporting on the overarching indicators in the PHOF.
The SII provides a starting point to understanding inequalities in life expectancy at a local level. Understanding the causes of this inequality, and, as you say, interventions that might reduce health inequalities should follow on from this. To help with the former, we have developed the Segment Tool (http://www.lho.org.uk/LHO_Topics/Analytic_Tools/Segment/TheSegmentTool.aspx), which provides information on the causes of death that underpin inequalities in life expectancy for each local authority. Targeting the causes of death which contribute most to the life expectancy gap should have a significant impact on reducing inequalities. But we also need to examine inequalities in the wider determinants of health to formulate interventions that will have the greatest impact on reducing health inequalities. Over time, PHE will release products that show best evidence on interventions to reduce health inequalities through action on the social determinants of health.
Best wishes,
Charlotte, Allan and Justine
Comment by Alisha Davies posted on
It is not sufficient to jsut consider LE, without considering if this is in good health. The inequalities in healthy life expectancy are much greater - "Males in the most advantaged areas can expect to live 19.3 years longer in ‘Good’ health than those in the least advantaged areas. For females this was 20.1 years." (Source: ONS report)
Comment by Charlotte Fellows posted on
Dear Alisha,
Thank you for your comments.
We agree that it is important to consider healthy life expectancy and inequalities in healthy life expectancy alongside life expectancy as a whole. In addition to the indicators on life expectancy, the Public Health Outcomes Framework data tool also contains an indicator showing inequalities in healthy life expectancy at national level, which shows differences in healthy life expectancy between the most and least deprived areas in England.
Best wishes,
Charlotte